

The cryptocurrency market is known for its volatility and emotional swings. Prices can skyrocket in moments of euphoria or plummet during periods of panic. To help investors navigate these turbulent waters, tools like the Crypto Fear and Greed Index have emerged as valuable indicators of market sentiment. This index provides a snapshot of the collective emotions driving the crypto market, boiling down complex data into a simple score that ranges from 0 to 100. A low score signals widespread fear, which might indicate undervalued assets and potential buying opportunities. A high score points to greed, suggesting the market could be overheated and due for a correction.
At its core, the Crypto Fear and Greed Index aims to quantify the psychological factors influencing investor behavior. It draws from the idea that extreme emotions often lead to irrational decisions, such as buying at peak prices out of fear of missing out (FOMO) or selling in a panic during downturns. By tracking these sentiments, the index helps users avoid emotional overreactions and make more informed choices. Primarily focused on Bitcoin due to its dominant role in the crypto ecosystem, the index also offers insights applicable to other major cryptocurrencies. Developed as an adaptation of similar tools from traditional finance, it has become a staple for traders and investors seeking an edge in the fast-paced world of digital assets.
History and Origins of the Index
The concept of a Fear and Greed Index did not originate in the crypto space. It traces its roots back to traditional stock markets. In 2012, CNN Money introduced a Fear and Greed Index for equities, designed to gauge whether stocks were fairly priced by analyzing emotional drivers in the market. This tool aggregated various indicators to reflect investor sentiment, helping to identify when fear or greed was pushing prices away from fundamentals.
Recognizing the even more volatile nature of cryptocurrencies, the team at Alternative.me adapted this framework for the crypto market. Launched around 2018, the Crypto Fear and Greed Index tailored the methodology to suit the unique characteristics of digital assets, such as rapid price swings and heavy influence from social media. Unlike the stock version, which includes factors like safe-haven demand and market breadth, the crypto index emphasizes elements more relevant to Bitcoin and altcoins, such as dominance and online search trends.
Over time, other platforms have created their own variations. For instance, CoinMarketCap developed a proprietary Fear and Greed Index, which also ranges from 0 to 100 and focuses on overall market sentiment. Binance and other exchanges have integrated similar tools into their interfaces, making sentiment analysis accessible to a broader audience. These adaptations highlight the index’s growing popularity and its evolution as a key metric in crypto analytics.
How the Crypto Fear and Greed Index is Calculated
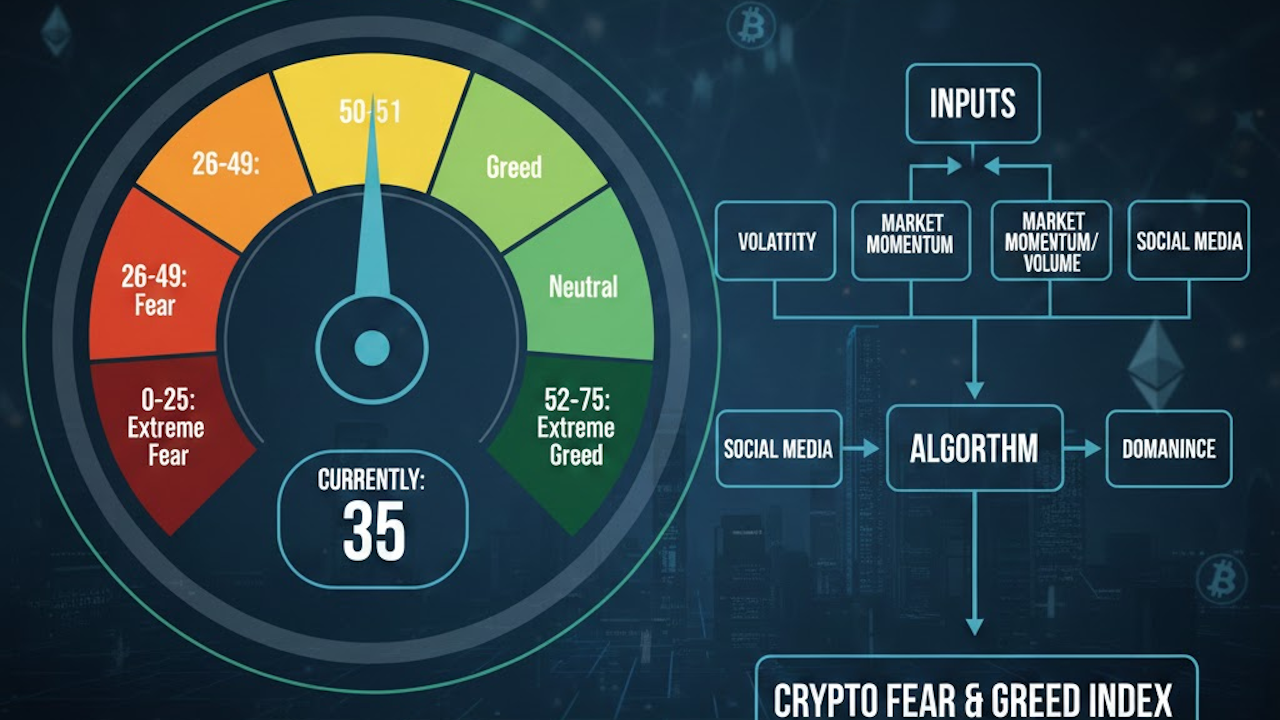
The Crypto Fear and Greed Index is not a random guess. It is a data-driven metric compiled from multiple sources, each contributing to the final score. The original index from Alternative.me uses six primary factors, weighted differently to reflect their impact on market sentiment. These are updated daily to provide a real-time view.
First, volatility accounts for 25% of the score. This measures Bitcoin’s current price fluctuations and maximum drawdowns compared to its 30-day and 90-day averages. High volatility often signals fear, as it indicates uncertainty and potential losses.
Next, market momentum and volume also contribute 25%. This factor looks at current trading volumes and price momentum relative to recent averages. Sustained high buying volumes in an uptrend suggest greedy behavior, as investors pile in expecting further gains.
Social media makes up 15% of the calculation. By analyzing Twitter (now X) posts, hashtags, and engagement rates related to Bitcoin, the index detects spikes in public interest. Rapid increases in mentions and interactions typically point to greed, as hype builds.
Surveys, also at 15%, involve polling investors on their outlook. Although this component is currently paused on Alternative.me, it historically gathered thousands of votes weekly to directly capture sentiment.
Bitcoin dominance contributes 10%. This tracks Bitcoin’s share of the total crypto market capitalization. A rising dominance often reflects fear, as investors flee to the perceived safety of Bitcoin during altcoin downturns. Conversely, a declining share suggests greed toward riskier altcoins.
Finally, trends account for the remaining 10%. Using Google Trends data, this examines search volumes for Bitcoin-related queries. Surges in searches like “Bitcoin price manipulation” can indicate fear, while general interest spikes signal greed.
These factors are normalized and combined into a single score, ensuring the index remains consistent over time. Variations like CoinMarketCap’s index may use slightly different weights or additional data, but the core principle remains the same: aggregating signals to measure emotion.
The Scale and What It Means
The index’s 0 to 100 scale is straightforward yet powerful. A score of 0 represents “Extreme Fear,” where panic selling dominates and prices may be undervalued. At the other end, 100 signifies “Extreme Greed,” indicating euphoric buying that could precede a market top.
Scores are often categorized for easier interpretation:
- 0-24: Extreme Fear (potential buying opportunity as fear drives prices down).
- 25-49: Fear (market caution, possible undervaluation).
- 50-74: Greed (optimism building, but watch for overextension).
- 75-100: Extreme Greed (high risk of correction as greed inflates prices).
Color-coding enhances usability, with reds and oranges for fear zones and greens for greed. This visual aid helps traders quickly assess the market’s emotional state without diving into raw data.
Using the Index in Trading and Investing
The Crypto Fear and Greed Index is a contrarian tool at heart. Warren Buffett’s famous advice to “be fearful when others are greedy and greedy when others are fearful” aligns perfectly with its philosophy. During extreme fear, savvy investors might accumulate assets, betting on a rebound. In extreme greed, they could take profits or hedge positions to protect against downturns.
For day traders, the index serves as a sentiment overlay on price charts. A sudden shift from greed to fear might signal a trend reversal, prompting short positions. Long-term holders, or “HODLers,” use it to time entries during bear markets, avoiding the pitfalls of buying at highs.
Integration with other indicators amplifies its value. Pairing it with technical analysis, like moving averages or RSI, provides a fuller picture. For example, if the index shows extreme greed alongside overbought RSI, it strengthens the case for a pullback.
Platforms like Binance offer real-time widgets, allowing users to monitor the index alongside prices. APIs from Alternative.me enable developers to incorporate it into custom tools, further expanding its utility.
Historical Examples and Insights
History offers numerous lessons on the index’s predictive power. During the 2021 bull run, the index frequently hit extreme greed levels above 90 as Bitcoin surged past $60,000. This greed preceded the May 2021 crash, where fear took over and the score dropped below 20.
In the 2022 bear market, prolonged extreme fear scores in the teens coincided with Bitcoin’s dip below $20,000, signaling capitulation and eventual recovery opportunities. More recently, as of February 2, 2026, the index stands at 14 (Extreme Fear), down from 20 last week and 29 last month, reflecting ongoing market jitters.
These patterns underscore how sentiment cycles influence prices. While not infallible, the index has often highlighted turning points, aiding those who heed its warnings.
Variations and Alternatives
Beyond Alternative.me’s version, several alternatives exist. CoinMarketCap’s index emphasizes broader market data, potentially offering a more diversified view. Some platforms, like Bitcoin Magazine Pro, provide color-coded charts and historical trackers for deeper analysis.
Critics note that reliance on Bitcoin-centric data may overlook altcoin-specific sentiments. Future developments could include separate indices for major coins like Ethereum.
Limitations and Criticisms
No tool is perfect. The index’s heavy weighting on volatility and volume can amplify short-term noise, leading to false signals. Social media data might be manipulated by bots or hype campaigns, skewing results. Paused surveys reduce its direct input from investors.
Moreover, sentiment is just one piece of the puzzle. Fundamental factors like regulatory news or technological upgrades can override emotional signals. Users should combine the index with comprehensive research to avoid overreliance.
Conclusion
The Crypto Fear and Greed Index demystifies the emotional undercurrents of the cryptocurrency market, offering a numerical lens through which to view investor psychology. By understanding its calculation, scale, and applications, traders can better position themselves amid volatility. Whether spotting buying dips in fear or locking in gains during greed, this tool empowers informed decision-making. As the crypto landscape evolves, so too will sentiment indicators, but the foundational principle remains: emotions drive markets, and mastering them is key to success.